Common ways to display data: Percentages
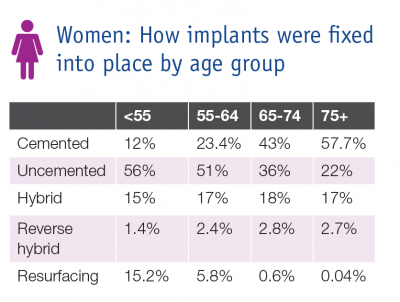
The table below uses percentages (expressed as %) to show data collected and presented by the National Joint Registry, around how joint implants were fixed into place by age group, for women.
Percentages translate literally as ‘per hundred’, and are useful when comparing groups. A percentage is calculated by dividing the number of observations by the total in a sample and multiplying by 100.
Question:
Using the table, which implant method and age group represent the highest percentage?
Click below to check your answer.
Incorrect. Please try again.
Incorrect. Please try again.
57.7% is the highest percentage from the table. All other percentages are lower.
