Common ways to display data: Pie Chart
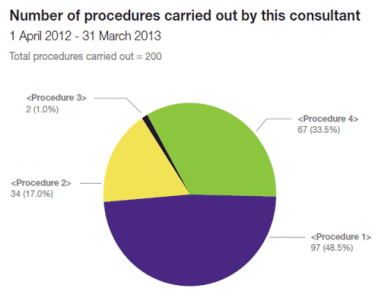
A pie chart provides some sense of quantity, for example, here each section of the ‘pie’ is in true proportion to the number of different procedures (1-4), carried out by a particular consultant.
The chart also shows total numbers of procedures, and the percentage of total procedures each number represents.
Question:
Using the pie chart, which procedure was carried out least often?
Click below to check your answer.
Incorrect. Please try again.
Incorrect. Please try again.
Procedure 3 is carried out least often. It is the smallest section of the pie chart.
Incorrect. Please try again.
